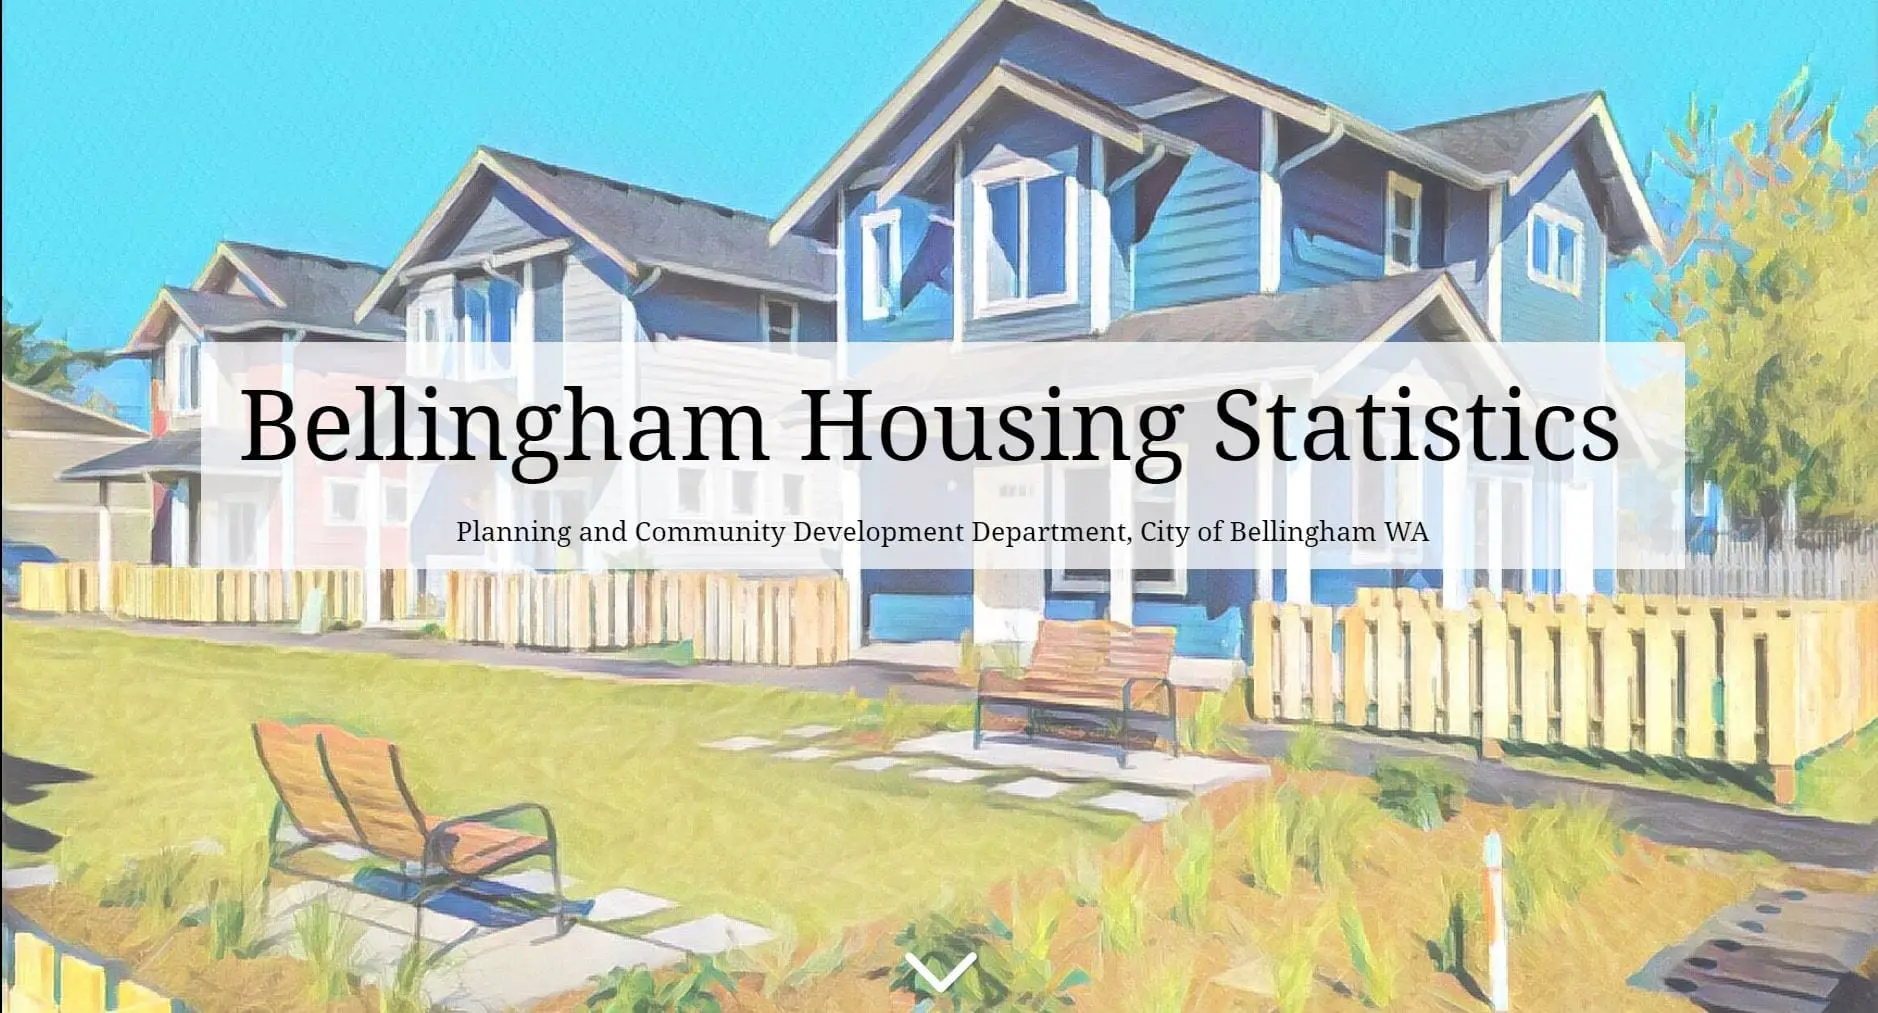
The City of Bellingham's Planning and Community Development Department has released a new story map detailing the housing statistics of Bellingham.
This information-rich story map features interactive maps, graphs and supporting texts that explore housing types, occupancy, tenure, and their distribution across the city's neighborhoods.
Rick Sepler, Planning and Community Development Director, welcomes active conversation in the Bellingham community about housing and encourages residents to review the story map to learn more about current housing.
“A fundamental role of the City is to provide clear and accurate information to our community members so that they can be informed participants in helping to shape the future of Bellingham,” Sepler said. “The Bellingham Housing Statistic site does just that.”
The Planning and Community Development Department states on the story map page that the best way to solve complex problems is through education, dialog and innovation. The City encourages residents to use the information presented in the story map to educate themselves and others as well as to facilitate community conversations about housing, housing affordability and where Bellingham is headed next.
The data provided in the story map comes from a variety of sources including City of Bellingham building permits as well as Whatcom County Assessor, U.S. Census, Washington Office of Financial Management and Housing and Urban Development data.
To access the story map, visit www.cob.org/housingstats. It works on any media platform but is best viewed on a desktop environment.

