The City of Bellingham has been leading the way on climate action in the public sector for nearly two decades. In 2005, Bellingham City Council committed to the Cities for Climate Protection Campaign and its five milestones, which resulted in Bellingham’s 2007 Climate Protection Action Plan. The City has since completed the five Climate Protection milestones and renewed its commitment to greenhouse gas emissions reductions in its Climate Action Plan 2018 Update. The Climate Action Plan will be updated every five years.
In May 2018, Bellingham City Council passed a resolution to create the Climate Action Plan Task Force, a group of community members with experience in relevant fields that produced a final report in December 2019 with recommendations for how Bellingham can accelerate our 100% renewable energy targets.
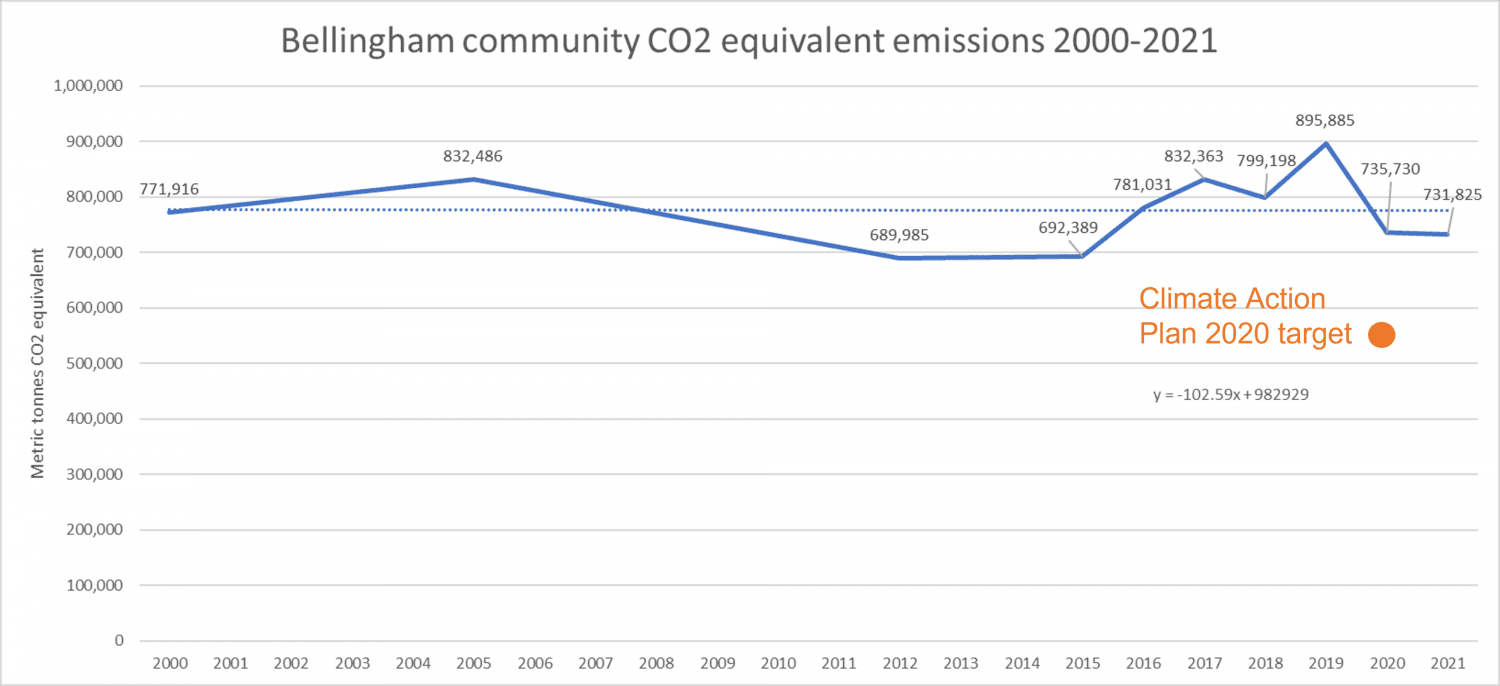
Bellingham Climate Emissions, 2000-2021
The City has conducted greenhouse gas inventories periodically going back to the year 2000, which is used as the baseline for assessing progress on emissions reduction targets.
2021 Emissions Inventory
The most recent inventories were completed by City staff in 2021 for the years 2015 to 2021. The results were presented during the Climate Action Committee meeting on November 7, 2022. The main takeaways from these inventories are:
- Total emissions have plateaued since we started recording emissions in 2000. Per capita emissions have reduced over time despite an approximate population increase of 30% over the same time period.
- We did not meet our emissions reduction target for 2020. We missed it by approximately 25%. Our current and future targets are becoming more challenging to reach over time due to plateauing emissions.
- We will need a change in policies and spending at a local, state, and federal level to meet 2030 targets. Emissions reduction efforts are needed across multiple sources and categories.
Municipal and Community Emissions
Approximately 2% of Bellingham’s climate emissions result from City government (municipal) operations. Municipal sectors include buildings and facilities, transportation fleet, employee commute, streetlights, waste and sewer utility and waste. The remaining 98% of emissions result from sectors in the Bellingham community (within City limits), including transportation, residential energy, commercial energy, industrial energy and solid waste.

Community Emissions Goals
By 2030, we seek to help the Bellingham community reduce its emissions by 40% below 2000 levels by addressing the transportation, residential, commercial, industrial and solid waste sectors. The community emissions target for 2050 is 85% below 2000 levels.

Municipal Emissions Goals
By 2030, we seek to further reduce municipal greenhouse gas emissions to 85% below 2000 levels by addressing emissions associated with our water and wastewater treatment facilities, buildings and facilities, vehicle fleet, employee commute, streetlights and traffic signals, and solid waste facilities. By 2050, we aim to reduce these emissions by 100% below 2000 levels, making the city government carbon neutral.

